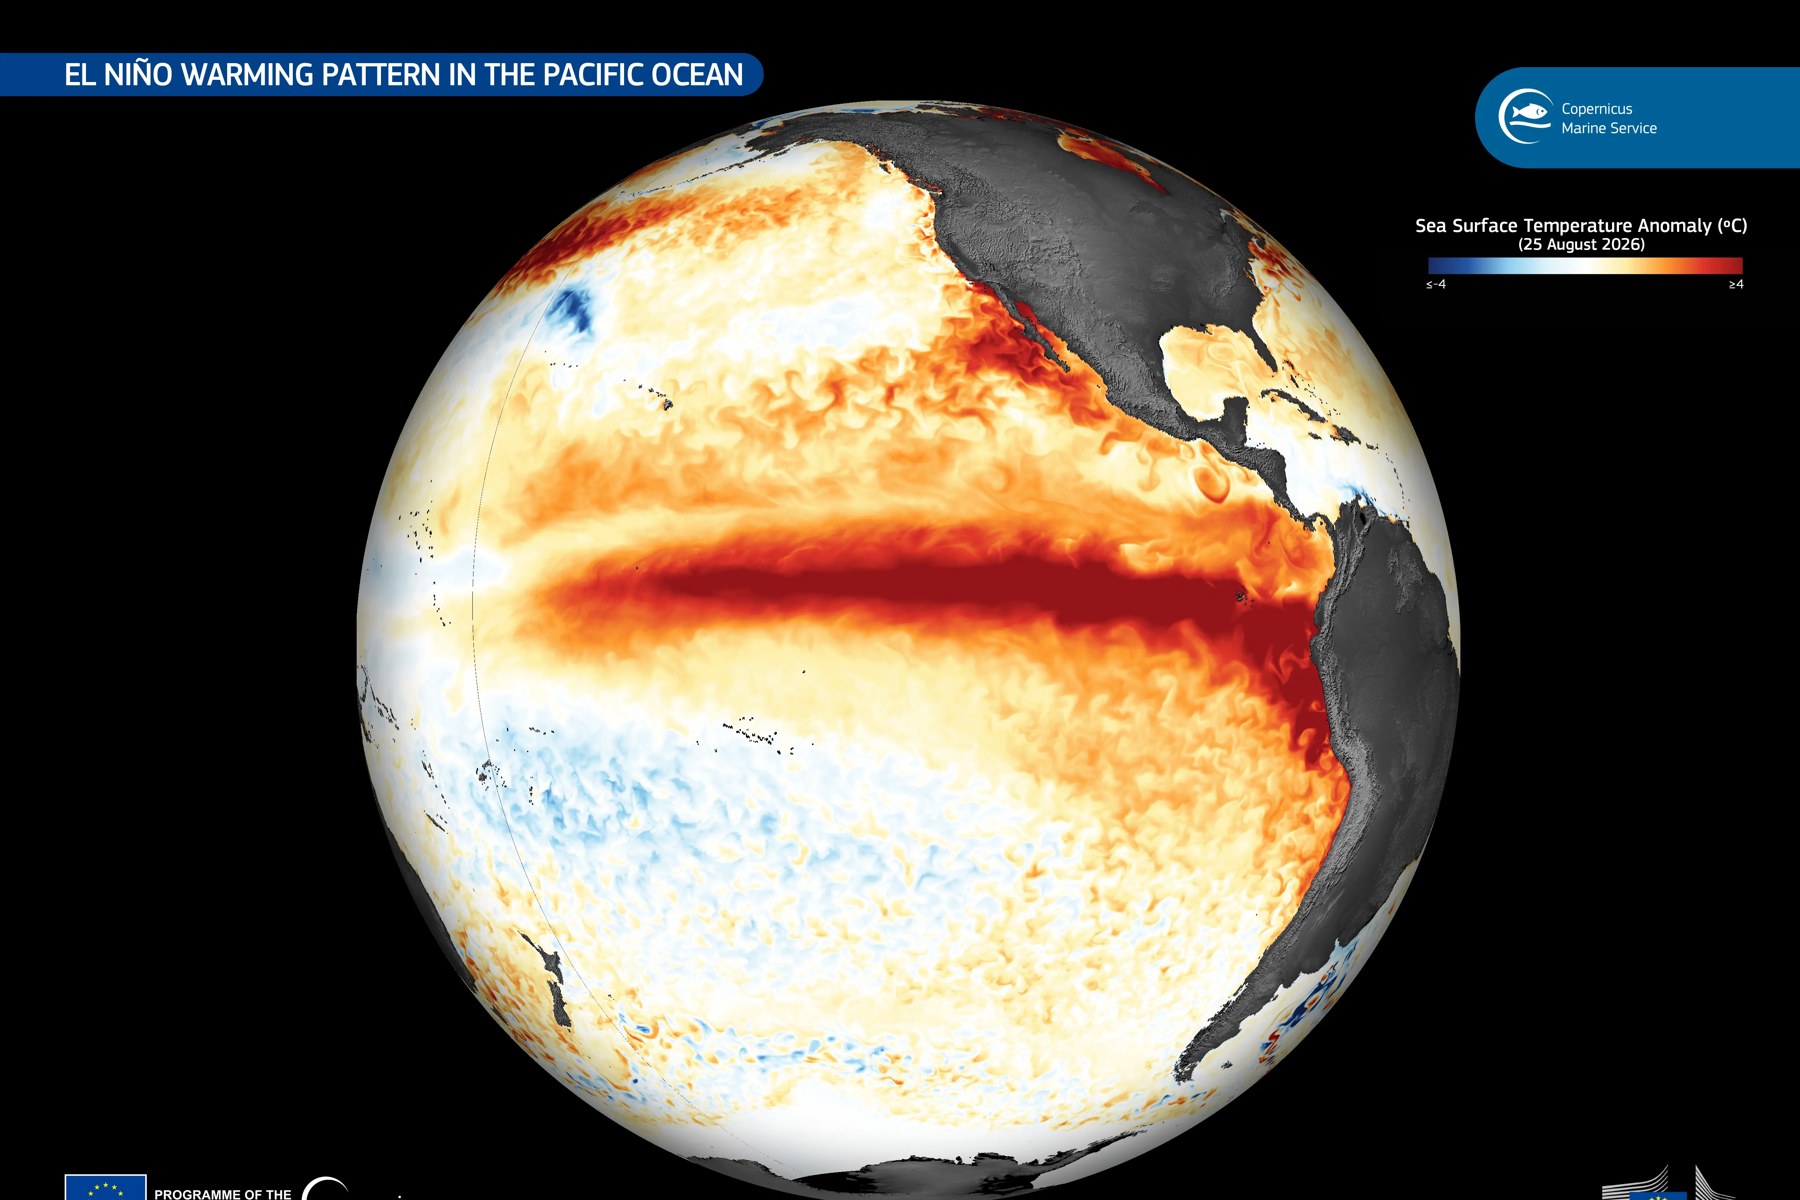
The European Union’s Copernicus Climate Change Service reported that the monthly average sea-surface temperature in the Nino3.4 region was 29.70 C in September. Nino3.4 is the central-eastern equatorial Pacific box that forecasters watch to track El Nino. The figure is the highest in the ERA5 record for the region, and it is an absolute temperature, not an anomaly. ERA5 is a reanalysis produced by ECMWF for Copernicus, a dataset built by combining past observations with weather models.
A record temperature is not the same as the strongest event. AFP, the French news agency, reported that Copernicus cannot yet say that the current El Nino is the strongest ever recorded. The release page’s date field reads Oct. 12, 2026, while its dateline line reads Bonn, 09/10/2026, which the page does not explain.
Absolute temperature versus anomaly
An absolute temperature, such as 29.70 C, is how warm the water was. An anomaly is the departure of that temperature from a baseline average. Against a fixed 1991-2020 baseline in ERA5, both are records: the temperature of 29.70 C, and an anomaly of 2.99 C that beat the 2.81 C of December 1997.
A fixed baseline does not remove long-term warming, so the 2.99 C against 2.81 C comparison is not a like-for-like ranking of strength. Carbon Brief, a climate analysis site, says relative indices adjust for tropical ocean warming but can also diminish the apparent strength of strong events. AFP reported that climate change raises ocean temperatures, which can make recent El Nino events appear stronger than past ones.
One such relative measure is the Relative Oceanic Nino Index, or RONI: the Nino3.4 anomaly minus the average anomaly of the wider tropics (20 degrees north to 20 degrees south), rescaled to the Nino3.4 variance. AFP and Carbon Brief give the warming of the tropical ocean as the reason such indices exist.
What Copernicus reported
Copernicus said Nino3.4 sea-surface temperature averaged 29.70 C in September 2026. Its press release says this is an all-time high for the region, above the peaks of the 1982/83, 1997/98 and 2015/16 events. The release page notes that ERA5 sea-surface values estimate the ocean temperature at about 10 metres depth, known as foundation temperature, that they may differ from other sea-surface temperature products, and that rankings depend on ERA5 and its record length.
The anomaly figures come from Copernicus’s surface air temperature bulletin, not the press release. The bulletin put the Nino3.4 anomaly at 2.99 C above the 1991-2020 average, the highest on record, against the previous record of 2.81 C in December 1997. It said anomalies were above 3 C across much of the central and equatorial Pacific, and reached 6 to 7 C along the Peruvian coast and west of the Galapagos Islands. It also noted that previous very strong events peaked between November and January.
Globally, ERA5 put average sea-surface temperature between 60 degrees south and 60 degrees north at 21.05 C in September, the highest for any September. The previous September record was 20.92 C, in 2023. Per Copernicus’s August release, August 2026 was higher still, at 21.07 C, tied with March 2024 as the highest for any month.
What Copernicus says about strength
The Copernicus press release says the event is likely to produce one of the strongest El Nino events on record, while its air-temperature bulletin says El Nino is expected to intensify into a very strong event over the coming months. The bulletin also says the current event is already notably stronger than the 2023 event at the same stage of development.
AFP also described a new index that accounts for the warming of tropical oceans, under which the event was reported as not yet stronger than past ones. AFP added that the September values point to an already exceptionally strong El Nino, especially as the event has not peaked. As of Oct. 12, neither the Copernicus release nor its bulletin, as read, mentions a new or relative index, so that detail rests on AFP’s reporting.
How the agencies describe the event
NOAA’s Climate Prediction Center (CPC) defines El Nino conditions as a one-month positive relative sea-surface temperature anomaly of 0.5 C or more in the Nino3.4 region, an expectation that the three-month RONI threshold will be met, and an atmospheric response typically associated with El Nino. CPC’s historical tables color a period as an El Nino when the three-month index is +0.5 C or more for at least five consecutive overlapping seasons. A CPC notice cited on its ONI page says RONI is used for official monitoring and prediction. The Oceanic Nino Index (ONI) is the rolling three-month average of the Nino3.4 anomaly, based on centered 30-year base periods updated every five years. Carbon Brief gives strength bands for the Nino3.4 anomaly, without saying whether they apply to daily, monthly, ONI or RONI values: weak at 0.5 C or more, moderate above 1.0 C, strong above 1.5 C and very strong above 2.0 C.
CPC, in its discussion of Oct. 8, kept an El Nino Advisory in effect and said a strong-to-very-strong event is likely through January-March 2027, with a greater than 83% chance. CPC defines a historic event as a three-month RONI of +2.5 C or more, exceeding all events back to 1950. It gave the chance of a historic event as 54% for September-November, 83% for October-December and 70% for November-January. CPC reported a Nino3.4 anomaly of +2.1 C. The discussion gives no averaging period for that figure, and Yale Climate Connections described it as a weekly value. CPC’s weekly deck of Oct. 5 gave +2.3 C.
In CPC’s current ONI table (ERSST.v6), three-month peaks were 2.1 for 1982-83, 2.4 for 1997-98 and 2.6 for 2015-16, and the July-September 2026 value is 2.2. In CPC’s current RONI table (ERSST.v6) the peaks were 2.4, 2.3 and 2.3, and the July-September 2026 value is 1.7. An older ERSST.v5 version of the RONI table, still posted by CPC, lists the peaks as 2.5, 2.4 and 2.4.
The Japan Meteorological Agency (JMA), on its outlook page of Oct. 9, said El Nino conditions reached their strongest intensity on record. JMA reported a preliminary September deviation (its word for anomaly) of +4.0 C in its NINO.3 index, against the previous record of +3.6 C in December 1997. NINO.3 is a different region from Nino3.4 and uses JMA’s own sliding 30-year climatology, so the two numbers cannot be compared directly.
The World Meteorological Organization (WMO), on Oct. 8, said there is a near-100% likelihood the event persists through February 2027, based on 13 forecasting centres. It reported a Nino3.4 anomaly of +2.5 C for August and forecast an October-December average of about +3.7 C, against a previous record of +2.6 C for November 2015 to January 2016. The +3.7 C is a model forecast three-month average. The figure caption on the WMO page says anomalies are relative to a 1993-2009 baseline period, and the page does not name the dataset.
Why the Nino3.4 numbers are not interchangeable
The Nino3.4 anomaly numbers in this article differ by dataset (ERA5 for Copernicus, NOAA’s own products for CPC), by baseline (a fixed 1991-2020 period for Copernicus, 1993-2009 for WMO, sliding 30-year bases elsewhere), by averaging period (monthly, weekly or three-month) and by method (a plain anomaly or a relative index). Copernicus’s 2.99 C and 2.81 C are monthly ERA5 values. The WMO figure of +2.5 C is for August, and the ONI and RONI peaks above are three-month values. Compare numbers only within the same source, dataset, baseline and averaging period, for example Copernicus’s 2.99 C against its own 2.81 C, and not across agencies or with CPC’s +2.5 C threshold.
The CPC +2.1 C and the WMO +2.5 C sit below the 2.99 C, but they refer to different months, datasets, baselines and measures, and the gap should not be read as disagreement. On Carbon Brief’s bands, the CPC +2.1 C is just above the very strong line, though the bands are Carbon Brief’s and the 2.99 C is on a different baseline.
What it means for global temperature
Copernicus said global air temperature averaged 16.27 C in September, the second-warmest September in its record. That is 0.82 C above the 1991-2020 average, 0.11 C cooler than September 2023 and 1.63 C above the 1850-1900 pre-industrial average. Per Copernicus’s August release, August air temperature was the joint-hottest month on record with July 2023, and the first month above 1.5 C since November 2025. The 12 months to September averaged 1.50 C above pre-industrial. The 1.5 C figure comes from the Paris Agreement’s long-term limit, which refers to multi-year warming, not to a single month.
Copernicus’s bulletin said that if the last three months of 2026 matched 2023, the 2026 annual average would be close to 2024’s record, and that January to September 2026 ranks second behind 2024.
The global effect of El Nino arrives with a delay. A March 2024 WMO explainer said the largest effect on global climate usually comes in the second year of an event’s development, and Carbon Brief said the effect on global temperature lags Pacific warming by several months. AFP reported that experts warned the event, combined with human-caused climate change, could make 2027 the hottest year on record. Copernicus director Carlo Buontempo said crossing the Paris limit is only a matter of time and that, with a strong El Nino intensifying, the warmth is likely to last into 2027.
Other September figures
Arctic sea-ice extent averaged 5.3 million square kilometres, the 16th lowest in the satellite record, about 10% below average. Antarctic extent was the third lowest for September, about 6% below average. The Copernicus sea-ice bulletin says surface winds likely contributed to the Antarctic drop and warm air over the Amundsen Sea may have also contributed. It says the atmospheric circulation pattern is typically linked to El Nino’s influence in the South Pacific. It does not say El Nino caused this September’s drop.
Copernicus also reported record-low September river flows on parts of several European rivers, including the Rhine, Danube, Vistula and Garonne-Dordogne, and, in its hydrological bulletin, the Ebro, in a record that covers 1992 to 2026. As of Oct. 12, the hydrological bulletin, as read, shows no El Nino link. In Europe, land air temperature was 16.26 C, the third-warmest September, and Portugal had its warmest September on record.
What is not known
The peak timing and size of the event are not settled. Agencies expect a peak near the end of 2026 and into early 2027. AFP reported that global forecasters have been warning for months that this El Nino would likely become the strongest ever observed. Whether it will be recorded that way depends on the index used and on where the peak lands. Carbon Brief noted in September that no seasonal forecast system has been verified against an event of this size.
Regional effects are also uncertain. CPC says that with an event of this magnitude the chance of impacts consistent with El Nino is larger, but not guaranteed.
What comes next
JMA’s next update is due Nov. 10, and CPC’s next discussion is scheduled for Nov. 12, which will refresh its odds for a strong, very strong and historic event. CPC also publishes a weekly slide deck with the latest Nino3.4 value.